
What is CCD2?
Expressing, purifying and crystallizing proteins requires a lot of truncation constructs. CCD2 will help you design and clone those constructs in a simple manner. You can also use CCD2 to retrieve the cDNA coding for a known protein in Uniprot, or simply as a convenient way to analyze your protein or to generate a multiple alignment of it (metazoan proteins only).
How to use CCD2?
1 - Input the DNA corresponding to your protein of interest.
Option 1: input your own sequence
If you have the DNA sequence of your protein at hand, you can simply paste it in the “DNA sequence area” and press submit. Note that if your protein is encoded by a synthetic, codon optimized gene, this is the only option available to you if you want to successfully design cloning primers. Using the natural sequence will simply produce the wrong primer.Option 2: retrieve the natural DNA sequence from a database
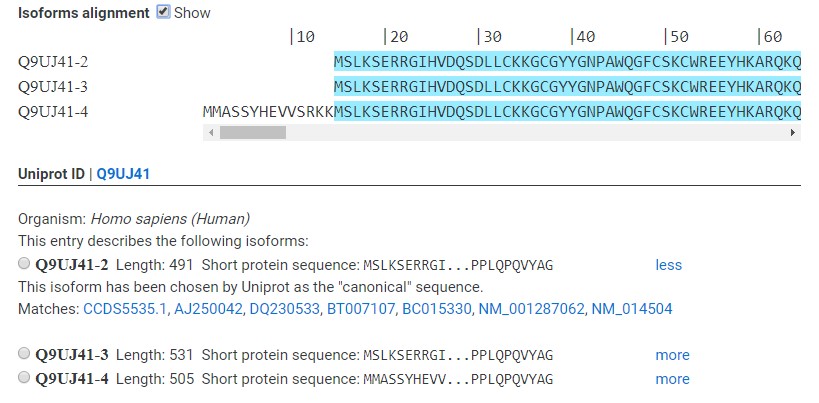
If your protein is present in the Uniprot database, CCD2 can retrieve the canonical DNA sequence that codes for it by searching and parsing the NCBI database. Simply enter the Uniprot entry name (e.g. RNPS1_HUMAN) or the Uniprot accession number (e.g. Q15287) of your protein in the box marked with “Uniprot ID or Accession” and press the Search button. This might take a while, depending on network condition and the responsiveness of the database website. After parsing the Uniprot database, CCD2 will display the search results in a manner similar to the example below (RBX5_HUMAN). Clicking on the dot beside one isoform will paste the correct sequence in the “DNA sequence area”. To continue, click on Submit. More details on the info presented in this section are described below.Example of search result:
Splicing isoforms
Three distinct splicing isoforms have been reported for this protein, and CCD2 has found DNA coding for each of them. To display the difference between the three splicing isoforms, you can tick the “Show” box beside “Isoform alignment”. The box is unticked by default. This will expand the isoform panel, which contains a protein alignment of each isoform. Identical positions are shaded in cyan, and position that differ in at least one isoform are left uncolored. In this example, isoform 4 has an extra small exon at the N-terminus compared to the other two isoforms. Note that the numbering is based on the longest sequence, which might or might not be the reference isoform.Uniprot ID
This line tells you what the accession number of your protein is in Uniprot (Q9UJ41). Accession numbers are guaranteed to be maintained across Uniprot datab ase version, unlike entry names, which might change over time. By clicking on the displayed accession number, you can access the Uniprot entry of your protein.Isoform selection panel
Here you can choose which isoform you want to work on. CCD2 will use the protein and DNA sequence of your chosen isoform in the rest of the workflow. Clicking on the dot beside one isoform will paste the correct sequence in the “DNA sequence area”. To continue, click on Submit. A short summary is displayed for each isoform. More information can be expanded by clicking on “more” to the side of each isoform, or hidden again by clicking “less”. The expanded isofrom description will also tell you which DNA database entries code for this isoform. Clicking each database entry will lead you to the corresponding page in the CCDS or NCBI databases (opens in new tab). If an isoform name is displayed in orange, this means that the protein sequence present in Uniprot does not correspond exactly to any DNA entry in the NCBI or CCDS databases. Rather, an entry exists that codes for a very similar protein (less than three point mutations in the sequence). This might be caused by annotation errors or by different “reference” sequence having been chosen over time and having failed to propagate to Uniprot. If an isoform name is displayed in red, no DNA entry could be found that codes for that isoform. This is rare. Since CCD2 does not process genomic DNA, there might still be a database entry somewhere that codes for this isoform, but you might have to look on your own. The uniprot entry of the protein isoform might contain more links than CCD2 is able to parse. On some rare occasions, Uniprot entries exist that do not link to any DNA database entry. CCD2 cannot continue and will throw an error.2 – Select the boundaries of your construct(s).
After clicking the “Submit” button, CCD2 will perform some predictions on your sequence, and display these in the “Select Start/Stops panel. You can then use these predictions to decide which truncation constructs you want to generate, so that you can design primers in the next section.
Basic usage: simply select Start and Stop positions:
On top left of the panel you will see three buttons (their arrangement might vary depending on the width of your screen.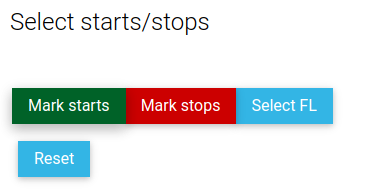
Below those (and below a multiple sequence alignment, if your sequence is from Vertebrates) you will see your query sequence displayed together with the corresponding position numbers.

The truncation point where your desired construct should start is called a “Start”. The point where your truncation construct should end is called a “Stop”. Note that the aminoacid corresponding to a start or stop point will be included in the final construct.
The “Mark start” and “Mark stop” buttons toggle your mouse cursor between marking starts or stops. The darkest button indicates which mode is active. The “Select FL” button will select the full length protein to be amplified (i.e. add the first and last amino acids of the protein as start/stop). The “Reset” button erases all previously marked start and stops.
To mark a start on the sequence, make sure that you are in “Mark start” mode by clicking on the “Mark start” button (which is checked by default) and simply click on the first aminoacid of your construct. The aminoacid will be highlighted in green (e.g. Met 1 in the figure above). To deselect a start, simply click it again, and the shading will disappear. Analogously, you can mark stops by pressing the “Mark stop” button. Stop aminoacids will be marked in red. You can mark the same aminoacid as being both a start and a stop. Simply click it once in “Mark start” mode, and once again in “Mark stop” mode. The order of marking start and stop is not important, as long as both marks are added. Aminoacids that are both start and stop points will be marked in yellow and will generate two distinct primers in the next section. If necessary, the sequence can be scrolled using the horizontal scroll bar above or below it. Once you have selected all your start and stops, you can move on to the next section (“Design primers”)
More options
Inspect multiple sequence alignment to assess construct boundaries (vertebrate sequences only).
CCD2 will attempt to find a precalculated multiple sequence alignment for your sequence.
First, it will determine the Uniprot ID of the sequence closest to your query by blasting it against the Uniprot database (unless of course you started from a Uniprot ID / accession, which renders this step unnecessary).
If a match is found (identity > 98%), CCD2 will use that ID to query the ensembl genome database (www.ensembl.org), which contains precalculated multiple sequence alignments for many sequences.
If no uniprot ID or ensembl alignment are found, CCD2 will attempt to display the result of a BLAST search against Swissprot.
If an alignment is found, CCD2 will align your query to the ensembl alignment using the program muscle (Edgar et al., NAR 2004). To help with human understanding, each sequence in the alignment will be renamed as [G].[species]_[geneID]_[uniprotID], where [G] is the first letter of the genus, [species] is the species, [geneID] is the gene name (according to NCBI) and [uniprotId] is the uniprot accession/identifier. For example, human RabGef1 will be identified as “H.sapiens_Rabgef1_Q9UJ41”. Your query will always indicated with “Query”.
Alignment display options: the Realign toolbar.
By default, CCD2 will only display a reduced subset of sequence, corresponding to common model organisms and / or representative from each of the main phyla of the tree of life (more info). By unticking the “Representative species only” option in the “Realign” toolbar, and pressing the “Realign” button, CCD2 can calculate and display the full ensembl alignment (this might take a minute).
Ensembl defines orthology relation between the sequences according to various criteria. Click on the “?” to see the definitions found on the ensembl website, or hover the mouse cursor on each category for a succinct explanation. If desired, CCD2 can display only orthologs corresponding to certain orthology category. Tick / untick the appropriate box to select / deselect categories, and press the “realign” button to generate a new alignment. Note that the “Display only model organism” option overrides the other and might need to be unticked to take full advantage of ortholog selection.
Individual sequences in the alignment can be temporarily hidden from display by clicking on the grey bar in front of the sequence name. Note that this does not affect the gapping of the alignment. To show hidden sequences again, click on the “Show all” button.
Alignment display options: the Alignment toolbar.
Here you can choose to show or hide the alignment (“Show” button), or to hide/display the coloring by conservation (“Color” button). Clicking on “Color” will display a webpage with the explanation of the coloring scheme.
You can also choose to save the alignment (as displayed) in fasta format (plain text) by clicking on “Save as fasta”.
Predictions based on sequence.
To aid in construct design, CCD2 will perform a series of predictions based on the sequence of the query. In order, from top to bottom:
HNN, MLR, DPM, PREDATOR:
Secondary structure predictions based on the respective algoritms. See credit page for more info. “e” shows a predicted beta strand; “h” shows a predicted helix; “t” predicts a beta turn (DPM only); “-” is no secondary structure predicted.
IUPRED, GLOBPLOT, DISEMBL:
These algorithms predict globular versus disordered regions. See credits page for details.
Legend:
Iupred: d predicted disordered.
Globplot: G: predicted globular;
d predicted disordered; “-” no prediction.
Disembl provides three distinct prediction methods ("coils", "hot loops", "remark 465"). CCD2 colours each
position based on the level of agreement between the 3 methods.
Full (3/3) consensus:
d;
2/3 agreement: d;
1/3: -;
0/3: -
SMART, PFAM:
CCD2 can search the SMART and PFAM databases for the definition of known domains and low complexity regions. Spans of low complexity regions are indicated by a number of repetitions of the string“low complexity * *”. Globular domains are indicated by the repetition of “[domain name] * *” where domain name is the actual name of the domain predicted by smart, e.g. “ZnfA20 * *” indicates a zinc finger of the A20 family.
PFAM domains are indicated as @@@@ Name @@@@ or **** Name ****. Two symbols "@" and "*" are used to avoid confusing adjacent domains, but have otherwise no special meaning.
COILS:
This algorithm detects coiled coils using the algorithm described in the credits section. The confidence of coiled coil prediction in this algorithm varies between 0.0 and 1.0. For any position with coiled coil probability coiled coil higher than 0.5 (50%), the probability is displayed and colored in blue tints. 50% probability is displayed as “5”, 60% as “6”, etc. “0” indicates the maximum confidence (probability 100%)
NLS:
Prediction of nuclear localization signals. See credits for method details. The confidence of prediction varies between 0 and 1, and it is displayed for probability > 50% using the same symbols / colors described for the coiled coil prediction.
PDB_95, PDB_50to95, PDB_30to50:
CCD2 performs a blast search against the sequences of all the structure deposited in the PDB (regardless of technique). If any hits are found, these are scored by percentage of identity.
PDB_95 displays in color the regions of the query sequence that match sequences in the PDB with identity > 95%. If a region of sequence is colored, there exist in the PDB a known structure that has 95% identity to the query (for that region, at least). An identity of 95% essentially implies that the structure in the PDB is of the query protein itself, or of a very close homolog. “>” indicates the start of the similarity region between the query and at least one blast hit. Hovering over the symbol will indicate which PDB entries were hit for that starting point. “<” indicates the end of the matching region; hover to display the PDB id of the matching regions. “<>” indicates that at least a matching region starts at that position, and at least a matching region ends at that position.
Because of the way BLAST works, the start / end of a matching hit might not be the exact start / end of the deposited structure, but this is mostly the case.
PDB_50to95 will display the similarity region(s) to hits with identity between 50 and 95%; PDB_30to50 will do the same for identities between 30 and 50%.
PHOSPHOSITE:
If your sequence is from Homo sapiens or Mus musculus, CCD2 will query Phosphosite and check for known post-translational modification in your sequence. If any hits are found, these are displayed on the sequence in single letter code. A plus sign indicates that multiple modification types have been detected for that residue. Hits are colored in shades of blue, based on how often they have been experimentally detected, with darker blue indicating more commonly found modifications. The frequence is calculated by dividing the total reported modifications at each position by the total number of modifications reported on the whole sequence. The intent is to highlight positions in a protein that are most often found to be modified. Hovering over a hit will display a popup that will detail the type of modification(s) found at that position, and how many times each modification has been detected by high throughput (HT) and low throughput (LT) screens.
UNIPROT:
If your sequence is in the Uniprot database, CCD2 will display known post-translational modifications (PTMs). Hover on each annotation to receive more information about PTMs at that position. Annotations in Uniprot always refer to the "canonical" isoform, so this prediction will be disabled for alternative splicing isoforms to avoid misannotation.
“Save predictions” button:
All predictions can be saved in comma separated value format for offline use
“Save PDB hits” button:
The results of searching your sequence against the PDB database can be saved in comma separated value for offline use.
3 - Design primers
Once the boundaries of your construct(s) have been set, CCD2 will design your primers.
CCD can design primers for different cloning applications, and with different characteristics. Choose your design parameters.
You can give your oligos a name prefix (enter it in the “with prefix” text box). If no prefix is chosen, the oligos will be named Fw_# or Rv_#, where Fw and Rv indicate a forward or reverse oligo, and # is the position of the terminal aminoacid of the construct (start or stop).
Once you are satisfied, click the “Get Primers” button.
Cloning method
First, choose which type of primers you would like to design by clicking in the “Choose cloning method” section.
“LIC vectors” will design ligation independent cloning (LIC) primers that are suitable for use with the LIC vector series developed by the protein facility at the Netherlands Cancer Institute (http://proteinfacility.nki.nl/). Multiple vectors are available, with different tag / expression system combinations. Use the drop down menu to choose which vector you wish to use. Most vectors are compatible with each other: for instance, the primer overhangs used for petNKI_1.1 are compatible with pGEXNKI 1.7. To see which vectors are compatible with the currently selected one, tick the “Show” blox beside the drop down menu.
“Restriction cloning” allows to design primers for conventional cloning. If this method is chosen, you can select a filler sequence, a restriction site and a start / stop codon to build your primer overhangs. As an example, a forward primer with filler “GCG”, KpnI site and ATG codon would have an overhang sequence of GCGggtaccatg
“Custom” simply allows you to input a custom sequence as overhang for your primers. Do not forget that the overhang for the reverse primer needs to be input as reverse complement.
Overhangs
This window display the currently selected sequence for the primer overhangs, and reminds the user whether start / stop codons are present in the sequence.
Annealing
Here you can choose to design the part of your oligo that anneals to the DNA with a given melting temperature (Tm) or with a given length. Note that the melting temperature is calculated only for the part of the oligo that directly anneals to the gene, and does not include the overhang.
4 - Collect your results
Primers
In this window you can find all the primers you designed in a table. The left column has the primer name, and the right column has the primer sequence. In the primer sequence, the annealing sequence is shown in capital letters, and the overhang in lowercase letters.
You can select the primers and copy / paste them in excel, or save them in comma separated value (csv) format for excel by pressing the save button in the frame.
"Save Primers" Button
This button will save the generated primers as a comma separated value table. You can specify the file name in the textbox.
"Save Construct DNA" Button
This button will save the DNA sequence of all possible PCR constructs generated by your primers as a comma separated value table. By "possible constructs" we mean all the constructs where a start and stop primer couple amplifies within the open reading frame.
Plasmid maps
Here you can create an annotated DNA map of your construct(s) cloned in a NKI vector of choice for your record or for comparison with sequencing results.
This function is available only for LIC NKI vectors, and its frame is collapsed by default. To expand it, press on the “+” button on the top right.
The tab will display all protein truncation deriving from all possible combinations of start and stop primers. To create maps, simply select the desired constructs, select which vector you would like to virtually clone in, and hit the save button. This will save a zip file with your maps in genbank format with annotated features. To open the maps, use your favorite DNA editor.
Warning: This table does not take into account what overhangs are present in your designed primers (i.e. in the “Primers” section). CCD2 simply assumes that you have chosen the correct overhang to clone in each vector.
Polypeptides
Here all possible constructs deriving from all possible combinations of start and stop primers are displayed. By default, only untagged constructs are displayed, i.e. the exact sequence corresponding to the truncation of your protein. Beside the protein sequence are displayed, from left to right:
• The name and boundaries of the construct
• The molecular weight of the construct in kiloDalton
• The predicted isoelectric point of the construct
• The predicted extinction coefficient at 280 nm.
(see https://web.expasy.org/protparam/protparam-doc.html for explanation of how these properties work and how they are calculated)
To see the exact sequence of your construct after cloning in a LIC NKI vector, select the vector from the drop down menu, then
by pressing the “Show tagged constructs” button, you can display the sequence of the truncation construct with the fusion tag derived from your vector of choice. Clicking again hides the sequences.
By pressing the “Show cleaved constructs” button, you can display the final protein sequence after proteolytic removal of the fusion tag. The protease necessary to remove the tag is also displayed. Clicking again hides the sequences.
If you wish to save the sequence of your constructs, press the save button.
Inspect multiple sequence alignment to assess construct boundaries (vertebrate sequences only).
CCD2 will attempt to find a precalculated multiple sequence alignment for your sequence.First, it will determine the Uniprot ID of the sequence closest to your query by blasting it against the Uniprot database (unless of course you started from a Uniprot ID / accession, which renders this step unnecessary).
If a match is found (identity > 98%), CCD2 will use that ID to query the ensembl genome database (www.ensembl.org), which contains precalculated multiple sequence alignments for many sequences.
If no uniprot ID or ensembl alignment are found, CCD2 will attempt to display the result of a BLAST search against Swissprot.
If an alignment is found, CCD2 will align your query to the ensembl alignment using the program muscle (Edgar et al., NAR 2004). To help with human understanding, each sequence in the alignment will be renamed as [G].[species]_[geneID]_[uniprotID], where [G] is the first letter of the genus, [species] is the species, [geneID] is the gene name (according to NCBI) and [uniprotId] is the uniprot accession/identifier. For example, human RabGef1 will be identified as “H.sapiens_Rabgef1_Q9UJ41”. Your query will always indicated with “Query”.
Alignment display options: the Realign toolbar. By default, CCD2 will only display a reduced subset of sequence, corresponding to common model organisms and / or representative from each of the main phyla of the tree of life (more info). By unticking the “Representative species only” option in the “Realign” toolbar, and pressing the “Realign” button, CCD2 can calculate and display the full ensembl alignment (this might take a minute). Ensembl defines orthology relation between the sequences according to various criteria. Click on the “?” to see the definitions found on the ensembl website, or hover the mouse cursor on each category for a succinct explanation. If desired, CCD2 can display only orthologs corresponding to certain orthology category. Tick / untick the appropriate box to select / deselect categories, and press the “realign” button to generate a new alignment. Note that the “Display only model organism” option overrides the other and might need to be unticked to take full advantage of ortholog selection. Individual sequences in the alignment can be temporarily hidden from display by clicking on the grey bar in front of the sequence name. Note that this does not affect the gapping of the alignment. To show hidden sequences again, click on the “Show all” button. Alignment display options: the Alignment toolbar. Here you can choose to show or hide the alignment (“Show” button), or to hide/display the coloring by conservation (“Color” button). Clicking on “Color” will display a webpage with the explanation of the coloring scheme. You can also choose to save the alignment (as displayed) in fasta format (plain text) by clicking on “Save as fasta”.
Predictions based on sequence.
To aid in construct design, CCD2 will perform a series of predictions based on the sequence of the query. In order, from top to bottom:HNN, MLR, DPM, PREDATOR:
Secondary structure predictions based on the respective algoritms. See credit page for more info. “e” shows a predicted beta strand; “h” shows a predicted helix; “t” predicts a beta turn (DPM only); “-” is no secondary structure predicted.IUPRED, GLOBPLOT, DISEMBL:
These algorithms predict globular versus disordered regions. See credits page for details.Legend:
Iupred: d predicted disordered.
Globplot: G: predicted globular; d predicted disordered; “-” no prediction.
Disembl provides three distinct prediction methods ("coils", "hot loops", "remark 465"). CCD2 colours each position based on the level of agreement between the 3 methods. Full (3/3) consensus: d; 2/3 agreement: d; 1/3: -; 0/3: -
SMART, PFAM:
CCD2 can search the SMART and PFAM databases for the definition of known domains and low complexity regions. Spans of low complexity regions are indicated by a number of repetitions of the string“low complexity * *”. Globular domains are indicated by the repetition of “[domain name] * *” where domain name is the actual name of the domain predicted by smart, e.g. “ZnfA20 * *” indicates a zinc finger of the A20 family. PFAM domains are indicated as @@@@ Name @@@@ or **** Name ****. Two symbols "@" and "*" are used to avoid confusing adjacent domains, but have otherwise no special meaning.COILS:
This algorithm detects coiled coils using the algorithm described in the credits section. The confidence of coiled coil prediction in this algorithm varies between 0.0 and 1.0. For any position with coiled coil probability coiled coil higher than 0.5 (50%), the probability is displayed and colored in blue tints. 50% probability is displayed as “5”, 60% as “6”, etc. “0” indicates the maximum confidence (probability 100%)NLS:
Prediction of nuclear localization signals. See credits for method details. The confidence of prediction varies between 0 and 1, and it is displayed for probability > 50% using the same symbols / colors described for the coiled coil prediction.PDB_95, PDB_50to95, PDB_30to50:
CCD2 performs a blast search against the sequences of all the structure deposited in the PDB (regardless of technique). If any hits are found, these are scored by percentage of identity. PDB_95 displays in color the regions of the query sequence that match sequences in the PDB with identity > 95%. If a region of sequence is colored, there exist in the PDB a known structure that has 95% identity to the query (for that region, at least). An identity of 95% essentially implies that the structure in the PDB is of the query protein itself, or of a very close homolog. “>” indicates the start of the similarity region between the query and at least one blast hit. Hovering over the symbol will indicate which PDB entries were hit for that starting point. “<” indicates the end of the matching region; hover to display the PDB id of the matching regions. “<>” indicates that at least a matching region starts at that position, and at least a matching region ends at that position. Because of the way BLAST works, the start / end of a matching hit might not be the exact start / end of the deposited structure, but this is mostly the case. PDB_50to95 will display the similarity region(s) to hits with identity between 50 and 95%; PDB_30to50 will do the same for identities between 30 and 50%.PHOSPHOSITE:
If your sequence is from Homo sapiens or Mus musculus, CCD2 will query Phosphosite and check for known post-translational modification in your sequence. If any hits are found, these are displayed on the sequence in single letter code. A plus sign indicates that multiple modification types have been detected for that residue. Hits are colored in shades of blue, based on how often they have been experimentally detected, with darker blue indicating more commonly found modifications. The frequence is calculated by dividing the total reported modifications at each position by the total number of modifications reported on the whole sequence. The intent is to highlight positions in a protein that are most often found to be modified. Hovering over a hit will display a popup that will detail the type of modification(s) found at that position, and how many times each modification has been detected by high throughput (HT) and low throughput (LT) screens.UNIPROT:
If your sequence is in the Uniprot database, CCD2 will display known post-translational modifications (PTMs). Hover on each annotation to receive more information about PTMs at that position. Annotations in Uniprot always refer to the "canonical" isoform, so this prediction will be disabled for alternative splicing isoforms to avoid misannotation.“Save predictions” button:
All predictions can be saved in comma separated value format for offline use“Save PDB hits” button:
The results of searching your sequence against the PDB database can be saved in comma separated value for offline use.3 - Design primers
Once the boundaries of your construct(s) have been set, CCD2 will design your primers. CCD can design primers for different cloning applications, and with different characteristics. Choose your design parameters. You can give your oligos a name prefix (enter it in the “with prefix” text box). If no prefix is chosen, the oligos will be named Fw_# or Rv_#, where Fw and Rv indicate a forward or reverse oligo, and # is the position of the terminal aminoacid of the construct (start or stop). Once you are satisfied, click the “Get Primers” button.